 EN
EN

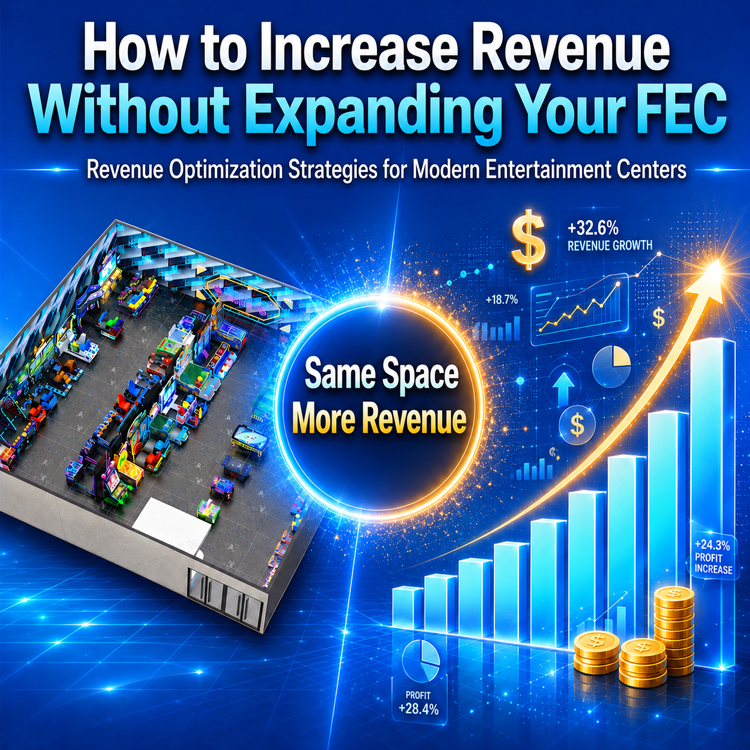
Many Family Entertainment Center (FEC) operators eventually reach the same challenge: revenue growth slows down, available space is fully utilized, and expansion appears to be the only solution.
However, expanding a venue is not always the most profitable option.
Additional space often means:
- Higher rent
- Increased staffing costs
- Additional maintenance expenses
- New equipment investments
- Longer ROI periods
In many cases, the fastest path to higher profitability is not increasing square footage but improving the performance of existing space.
Leading operators focus on FEC revenue optimization, improving revenue per square meter, increasing arcade revenue per machine, and maximizing overall FEC profitability.
This guide explores proven strategies used by successful operators to increase revenue without expanding their facilities.
Why Expanding Your FEC Is Not Always the Best Investment
Many operators assume that larger venues automatically generate more revenue.
Unfortunately, revenue growth and profitability are not always the same thing.
The Hidden Costs of Expansion
Cost Category |
Impact |
Rent |
Higher fixed expenses |
Staffing |
More employees required |
Utilities |
Increased operating costs |
Equipment |
Additional capital investment |
Maintenance |
Higher ongoing expenses |
As costs increase, profit margins often become more difficult to maintain.
This is why experienced operators first evaluate optimization opportunities before considering expansion.
Focus on Revenue Per Square Meter
One of the most important metrics in entertainment venue management is revenue density.
What Is Revenue Per Square Meter?
Revenue Per Square Meter = Total Revenue ÷ Total Floor Space
This metric measures how efficiently a venue generates income from available space.
Why Top Operators Track It
Benefits include:
- Better space utilization
- Improved attraction planning
- Stronger profitability
- More informed investment decisions
Revenue Density Example
Venue |
Size |
Monthly Revenue |
Revenue per m² |
Venue A |
500㎡ |
$50,000 |
$100 |
Venue B |
300㎡ |
$42,000 |
$140 |
Although Venue B is significantly smaller, it generates 40% higher revenue density.
This demonstrates why successful operators prioritize efficiency rather than size alone.
How Much Additional Revenue Can Optimization Generate?
Revenue optimization can create significant financial improvements without increasing venue size.
Revenue Improvement Example
Metric |
Before Optimization |
After Optimization |
Monthly Visitors |
4,000 |
4,000 |
Average Spend Per Guest |
$12 |
$15 |
Monthly Revenue |
$48,000 |
$60,000 |
Revenue Increase |
— |
+25% |
What Changed?
The operator did not:
- Expand the venue
- Add new staff
- Increase rent
Instead, they improved:
Attraction mix
- Equipment placement
- Pricing strategy
- Customer flow
This illustrates why revenue optimization is often more effective than expansion.
Replace Low-Performing Attractions
Not all attractions generate equal returns.
Some machines occupy valuable floor space while contributing little to overall revenue.
Key Performance Indicators
Operators should regularly evaluate:
KPI |
Purpose |
Plays Per Day |
Measures utilization |
Revenue Per Machine |
Indicates profitability |
Downtime |
Impacts performance |
Maintenance Cost |
Affects margins |
Space Utilization |
Influences revenue density |
Equipment Replacement ROI Example
Consider the following scenario.
Before
Equipment |
Monthly Revenue |
2 Traditional Video Games |
$600 |
After
Equipment |
Monthly Revenue |
4 Claw Machines |
$2,400 |
Results
Metric |
Value |
Revenue Increase |
$1,800/month |
Additional Annual Revenue |
$21,600 |
Estimated Payback Period |
3–8 Months* |
Illustrative example only. Actual results depend on location, pricing, and customer demand.
This is why many operators replace low-performing equipment with higher-ROI attractions.
Which Arcade Machines Generate the Highest Revenue?
Not all attractions contribute equally to profitability.
High-ROI Attraction Comparison
Attraction Type |
Investment Level |
Revenue Potential |
ROI Potential |
Claw Machines |
Low |
High |
Very High |
Redemption Games |
Medium |
High |
High |
Basketball Games |
Low |
Medium-High |
High |
Racing Simulators |
Medium-High |
High |
High |
VR Attractions |
High |
Medium |
Medium |
Indoor Playgrounds |
High |
High |
High |
Why Claw Machines and Redemption Games Perform Well
They benefit from:
- High replay value
- Broad demographic appeal
- Small footprints
- Strong revenue per square meter
For many operators, these attractions serve as core profit drivers.
Improve Your Attraction Mix
One of the most common causes of stagnant revenue is an unbalanced attraction portfolio.
Traffic Drivers vs Profit Drivers
Successful venues balance both.
Traffic Drivers
Attractions that attract visitors:
- Racing simulators
- VR attractions
- Motion theaters
- Interactive experiences
Profit Drivers
Attractions that generate consistent revenue:
- Claw machines
- Redemption games
- Basketball games
- Prize redemption systems
A balanced attraction mix helps maximize both visitor numbers and profitability.
Increase Guest Dwell Time
Guest dwell time is one of the strongest predictors of spending behavior.
Why Longer Visits Matter
Longer visits often result in:
- More game play
- Additional card reloads
- Increased food and beverage purchases
- Higher prize redemption activity
Example Dwell Time Impact
Average Stay Time |
Revenue Opportunity |
1 Hour |
Baseline |
2 Hours |
Higher Spending |
3 Hours |
Significant Revenue Growth |
4+ Hours |
Premium Spending Potential |
Ways to Increase Dwell Time
- Family zones
- Redemption stores
- Membership programs
- Birthday packages
- Seasonal events
- Tournaments and competitions
Optimize Your Venue Layout
Many operators underestimate the impact of layout design.
In reality, customer flow directly influences revenue.
Common Layout Problems
- Congested areas
- Dead zones
- Poor attraction visibility
- Underutilized equipment
Revenue Benefits of Better Layout Design
Optimized layouts can:
- Increase attraction utilization
- Improve guest circulation
- Extend dwell time
- Boost spending opportunities
Example Layout Optimization Impact
Metric |
Before |
After |
Machine Utilization |
Moderate |
High |
Guest Flow Efficiency |
Low |
Improved |
Revenue per m² |
Index 100 |
Index 125 |
Real-World Revenue Optimization Example
Based on EPARK's project experience, revenue improvements often come from strategic optimization rather than expansion.
Representative Project Example
A mid-sized Family Entertainment Center wanted to improve profitability without increasing its footprint.
Optimization Actions
- Removed underperforming equipment
- Added redemption games
- Expanded prize redemption area
- Improved attraction zoning
- Upgraded customer flow design
Results
Performance Metric |
Before |
After |
Average Dwell Time |
Index 100 |
Index 135 |
Attraction Utilization |
Index 100 |
Index 128 |
Revenue per m² |
Index 100 |
Index 142 |
This example demonstrates how optimization can unlock hidden revenue opportunities.
Insights from 14+ Years of FEC Project Experience
Over the past 14 years, EPARK has supported amusement projects across more than 80 countries.
From small community arcades to large-scale destination FECs, one trend appears consistently:
The most profitable venues are rarely the largest.
Successful operators focus on:
- Revenue per square meter
- Attraction performance
- Guest engagement
- Strategic attraction planning
- Continuous optimization
Many venues achieve substantial revenue growth without increasing floor space.
How Professional Attraction Planning Improves Profitability
Revenue optimization starts long before new equipment is purchased.
Attraction Mix Analysis
Understanding which attractions generate the highest ROI.
Space Optimization
Maximizing the value of every square meter.
Revenue Forecasting
Evaluating potential returns before investing.
Layout Design Support
Improving customer flow and attraction visibility.
Professional planning helps operators avoid costly mistakes while improving long-term profitability.
Want to Increase Revenue Without Expanding?
Before investing in additional space, ask yourself:
- Which machines generate the highest revenue?
- Which attractions underperform?
- Is your current layout maximizing customer flow?
- Are you achieving the highest revenue per square meter?
EPARK Can Help You Identify Hidden Revenue Opportunities
Free Services Include:
✓ Revenue Optimization Review
✓ Attraction Mix Analysis
✓ Free 2D Layout Design
✓ Free 3D Venue Planning
✓ Equipment Upgrade Recommendations
✓ ROI-Based Attraction Selection
✓ Factory-Direct Equipment Supply
✓ OEM & ODM Customization
✓ One-Stop FEC Project Support
Many operators discover significant growth opportunities within their existing venue before expansion becomes necessary.
Conclusion
Increasing revenue does not always require expanding your Family Entertainment Center.
In many cases, improving attraction performance, optimizing customer flow, increasing guest dwell time, and enhancing revenue per square meter can generate stronger returns than costly expansions.
The most successful FEC operators focus on efficiency rather than size.
By leveraging data, improving attraction mix, and optimizing layout design, operators can unlock substantial growth opportunities while maximizing profitability from their existing space.
Table of Contents
- Why Expanding Your FEC Is Not Always the Best Investment
- Focus on Revenue Per Square Meter
- How Much Additional Revenue Can Optimization Generate?
- Replace Low-Performing Attractions
- Which Arcade Machines Generate the Highest Revenue?
- Improve Your Attraction Mix
- Increase Guest Dwell Time
- Optimize Your Venue Layout
- Real-World Revenue Optimization Example
- Insights from 14+ Years of FEC Project Experience
- How Professional Attraction Planning Improves Profitability
- Want to Increase Revenue Without Expanding?
- Conclusion