 EN
EN

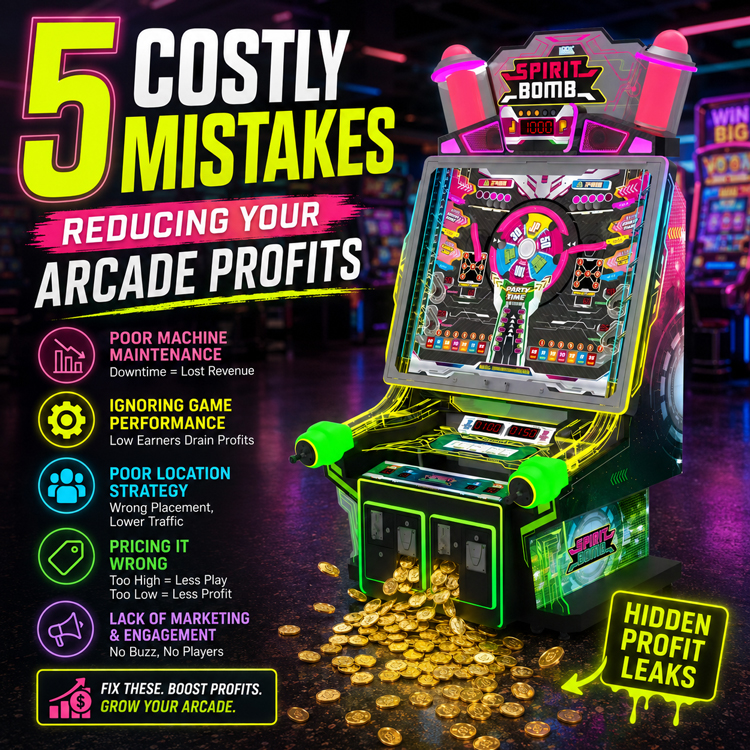
Why do some arcades generate healthy profits while others struggle to break even, even when they operate in similar locations?
Many operators blame poor market conditions, competition, or insufficient foot traffic. However, after analyzing Family Entertainment Centers (FECs), arcades, and amusement venues across multiple markets, a different pattern often emerges.
The biggest profit killers are usually internal.
Poor attraction planning, inefficient use of space, weak customer retention strategies, and a lack of performance tracking can quietly reduce profitability month after month.
The problem is that many operators do not realize how much money these mistakes are costing them.
In this guide, we'll explore five costly mistakes that reduce arcade profitability and ROI, quantify their potential impact, and explain how successful operators maximize revenue without necessarily increasing venue size.
How Much Can These Mistakes Cost an Arcade?
Before examining individual mistakes, it's important to understand the financial impact.
Estimated Annual Revenue Loss
Common Mistake |
Potential Annual Revenue Loss* |
Poor Attraction Mix |
$10,000–$50,000 |
Low Revenue per Square Meter |
$5,000–$30,000 |
Underperforming Machines |
$8,000–$40,000 |
Weak Customer Retention |
$10,000–$60,000 |
No Performance Tracking |
Difficult to Measure |
Illustrative examples based on common operating scenarios. Actual results vary by location, venue size, pricing strategy, and customer traffic.
For many operators, small inefficiencies compound into significant losses over time.
Mistake #1: Choosing Equipment Based on Price Instead of ROI
One of the most common mistakes among new arcade operators is focusing on equipment cost rather than revenue potential.
Why Cheap Machines Can Become Expensive
Low-cost equipment may initially reduce startup expenses, but it often creates long-term challenges:
Lower player engagement
Reduced utilization
More maintenance issues
Shorter product lifespan
ROI Matters More Than Purchase Price
Example Comparison
Attraction Type |
Investment |
Revenue Potential |
ROI Potential |
Claw Machines |
Low |
High |
High |
Redemption Games |
Medium |
High |
High |
Aging Video Games |
Low |
Low |
Low |
A machine that generates strong daily revenue can recover its cost much faster than a cheaper machine that attracts limited interest.
What Successful Operators Do
They evaluate:
- Revenue per machine
- Payback period
- Customer demand
- Revenue per square meter
- Long-term profitability
The goal is not to buy the cheapest machine but the machine with the strongest return on investment.
Mistake #2: Ignoring Revenue Per Square Meter
Floor space is one of the most valuable assets in any entertainment venue.
Yet many operators focus only on total revenue.
Why Revenue Density Matters
Revenue per square meter measures how efficiently an attraction uses available space.
Example Comparison
Attraction |
Space Required |
Monthly Revenue |
Revenue per m² |
Claw Machines |
10㎡ |
$3,000 |
$300 |
Large Simulator |
30㎡ |
$4,000 |
$133 |
Although the simulator generates more total revenue, the claw machine produces more than twice the revenue density.
Hidden Cost of Poor Space Utilization
Consider a 500㎡ venue.
If operators improve revenue density by just $20 per square meter per month:
500㎡ × $20 = $10,000 additional monthly revenue
Annual Impact:
$120,000
This illustrates why revenue per square meter is one of the most important metrics in FEC management.
Mistake #3: Having the Wrong Attraction Mix
Not all attractions serve the same purpose.
Many operators invest heavily in large showcase attractions while neglecting proven profit drivers.
Traffic Drivers vs Profit Drivers
Successful operators understand the difference.
Traffic Drivers
These attractions help attract visitors:
- VR attractions
- Racing simulators
- Interactive experiences
Profit Drivers
These attractions generate consistent revenue:
- Claw machines
- Redemption games
- Basketball games
Example Attraction Mix
Attraction Category |
Recommended Allocation |
Redemption Games |
35% |
Claw Machines |
25% |
Arcade Games |
20% |
Interactive Attractions |
10% |
VR Attractions |
10% |
A venue with too many traffic drivers often struggles with profitability.
A venue with only profit drivers may struggle to attract new visitors.
The most successful arcades balance both.
Mistake #4: Failing to Increase Repeat Visits
Acquiring new customers is expensive.
Retaining existing customers is often far more profitable.
Why Repeat Visitors Matter
Repeat guests typically:
- Visit more frequently
- Spend more annually
- Refer friends and family
- Improve long-term profitability
Customer Value Example
Customer Type |
Annual Spending Index |
First-Time Visitor |
100 |
Repeat Visitor |
250–400 |
Strategies That Improve Retention
Loyalty Programs
Reward frequent players and encourage return visits.
Prize Redemption Systems
Ticket accumulation motivates customers to continue playing.
Seasonal Events
Holiday campaigns, tournaments, and themed events create fresh reasons to visit.
The Profitability Impact
Increasing repeat visitation often generates stronger returns than increasing advertising budgets.
Mistake #5: Operating Without Data
Many operators still rely on intuition instead of measurable performance indicators.
This creates blind spots that limit growth.
Key Metrics Every Arcade Should Track
KPI |
Purpose |
Revenue per Machine |
Identify top performers |
Plays per Day |
Measure utilization |
Revenue per Square Meter |
Evaluate space efficiency |
Repeat Visit Rate |
Monitor customer loyalty |
Attraction ROI |
Support investment decisions |
Why Data Matters
Data helps operators:
- Remove underperforming equipment
- Optimize attraction mix
- Improve layout design
- Increase profitability
Without data, operators often continue investing in attractions that no longer perform well.
Profitability Impact Example
Small improvements can generate substantial financial results.
Scenario A: Poor Optimization
Metric |
Value |
Monthly Revenue |
$20,000 |
Operating Costs |
$15,000 |
Monthly Profit |
$5,000 |
Scenario B: Optimized Operations
Metric |
Value |
Monthly Revenue |
$25,000 |
Operating Costs |
$15,500 |
Monthly Profit |
$9,500 |
Results
Metric |
Improvement |
Revenue Growth |
+25% |
Profit Growth |
+90% |
This example demonstrates why operational efficiency often has a larger impact on profitability than simply adding more equipment.
What We See Across Global FEC Projects
Over the past 14 years, EPARK has supported amusement projects in more than 80 countries.
Across different markets, several patterns consistently appear among successful operators.
High-Performing Venues Regularly Replace Low-ROI Machines
They continuously evaluate attraction performance rather than keeping equipment indefinitely.
Successful Operators Track Revenue Per Machine
Monthly performance reviews help identify opportunities for improvement.
Claw Machines and Redemption Games Consistently Perform Well
Across many markets, these attractions frequently generate strong revenue density and repeat play.
Layout Optimization Creates Immediate Results
Improved customer flow often increases attraction visibility and utilization without requiring additional floor space.
Case Example: Improving Profitability Without Expanding
Challenge
A 500㎡ arcade experienced stagnant revenue despite steady visitor traffic.
Problems Identified
Several low-performing machines
Inefficient attraction placement
Weak redemption offering
Optimization Actions
Removed six underperforming machines
Added redemption games
Improved customer flow
Expanded prize redemption area
Representative Results
KPI |
Improvement |
Revenue per m² |
+25% |
Repeat Visits |
+18% |
Monthly Profit |
+32% |
Representative example based on common optimization outcomes. Results vary by venue.
This illustrates how profitability improvements often come from better planning rather than larger investments.
What Successful Arcade Operators Do Differently
The most profitable operators consistently follow several principles.
They Focus on Profit, Not Just Revenue
Higher revenue does not always mean higher profitability.
They Measure ROI Before Purchasing Equipment
Every attraction is evaluated based on expected returns.
They Optimize Their Attraction Mix
They balance traffic drivers with profit drivers.
They Track Performance Data
Data-driven decisions consistently outperform assumptions.
They Improve Revenue Per Square Meter
Space efficiency remains one of the most important profitability metrics.
Conclusion
Most arcade profit challenges are not caused by market conditions but by operational decisions.
Choosing equipment based on price, ignoring revenue density, maintaining the wrong attraction mix, neglecting customer retention, and failing to track performance data can significantly reduce profitability.
The good news is that these issues are often easier to fix than operators realize.
By focusing on ROI, attraction performance, revenue per square meter, and customer retention, arcade owners can unlock substantial profit growth without expanding their venue.
The most successful operators treat profitability as a process of continuous optimization rather than a one-time achievement.
Table of Contents
- How Much Can These Mistakes Cost an Arcade?
- Mistake #1: Choosing Equipment Based on Price Instead of ROI
- Mistake #2: Ignoring Revenue Per Square Meter
- Mistake #3: Having the Wrong Attraction Mix
- Mistake #4: Failing to Increase Repeat Visits
- Mistake #5: Operating Without Data
- Profitability Impact Example
- What We See Across Global FEC Projects
- Case Example: Improving Profitability Without Expanding
- What Successful Arcade Operators Do Differently
- Conclusion